How related posts are computed
⋅ 4 minute read ⋅ 725 words
The number next to related posts at the bottom of each page is the advertised post’s “similarity” to the currently viewed page (from 1.0 to -1.0).
I am using the following process to compute related posts locally:
- Summarise every post and TIL using local qwen (
qwen3.5:9bvia Ollama) with the following prompt:
You are an analyst and editor with many years of experience in reading and synthesizing content.
Here is a blog post:
<BLOGPOST>
{ blog_post }
</BLOGPOST>
Please create a comprehensive and concise summary of the blog post. Focus on the main concepts, key details, and central arguments.
<INSTRUCTIONS>
- Include any specific technologies, methods, or frameworks mentioned.
- Don’t use more than 7 sentences.
- Respond in plaintext. Don’t add formatting or linebreak characters to your response.
- Don’t repeat the instructions of the task. Respond directly.
</INSTRUCTIONS>
- Embed the summary using a qwen embedding model
qwen3-embedding:0.6band store the embedding and metadata about the post in a persistent ChromaDB vector database (a file on my computer). - Compute the cosine similarity between the embeddings for each pair of posts. A score of 1.0 indicates proportional vectors, a score of 0.0 orthogonal vectors, and a score of -1.0 opposite vectors.
- Write a yaml file that includes for every post a link to the most similar post and their similarity.
- Use a Hugo partial to include the data in the yaml file about the most relevant posts at the bottom of each page.
§Noteworthy
- When using Llama, I had to explicitly instruct the model not to restate the task. Otherwise, every summary would have started with “Here is your concise blog post summary in not more than 7 sentences.” which would create some artificial similarity in the embeddings.
- Most blog posts are shorter than 15000 characters, or 4000 tokens. I had to work this out to configure the model context correctly.
- ChromaDB’s default embedding model
all-MiniLM-L6-v2has 384 dimensions and a maximum input sequence length of 256 BERT tokens (~100–150 words). I checked some of the summaries and they were around 160 – 220 BERT tokens. I have since switched to a qwen embedding model which has much longer input context. A good embedding model leaderboard to help make a choice is available here .
§Example
For the blog post UK house price changes in real terms the LLM came up with this summary which was then embedded:
Model: qwen3.5:9b - response
The author critiques standard UK housing market reports for presenting nominal price changes that obscure local realities and ignore inflation, arguing instead for real house prices adjusted using CPI data from ONS alongside Land Registry transaction records. To address this gap, the post demonstrates a Python-based workflow utilizing pandas to merge regional property datasets with quarterly consumer price index figures to calculate purchasing power-adjusted values in 2025 pounds. The analysis focuses on specific areas around London and South England, visualizing trends for detached houses in counties like Surrey and Kent as well as flats within selected boroughs since 2015. Results reveal that while nominal prices may show modest growth or stagnation, real house prices have actually declined significantly over the last decade in many regions due to inflation outpacing asset appreciation. The author provides interactive tables comparing current valuations against historical data points from one, two, five, and ten years prior to highlight these divergences across different property types. By leveraging open APIs for Land Registry and ONS data stored as parquet files, the post offers a reproducible method for investors and buyers to assess true market performance beyond headline statistics. Ultimately, this approach clarifies that British housing has often underperformed relative to other investments like the FTSE 100 when viewed through an inflation-adjusted lens.
§Embeddings
I can visualise the embeddings in two dimensions using t-SNE :
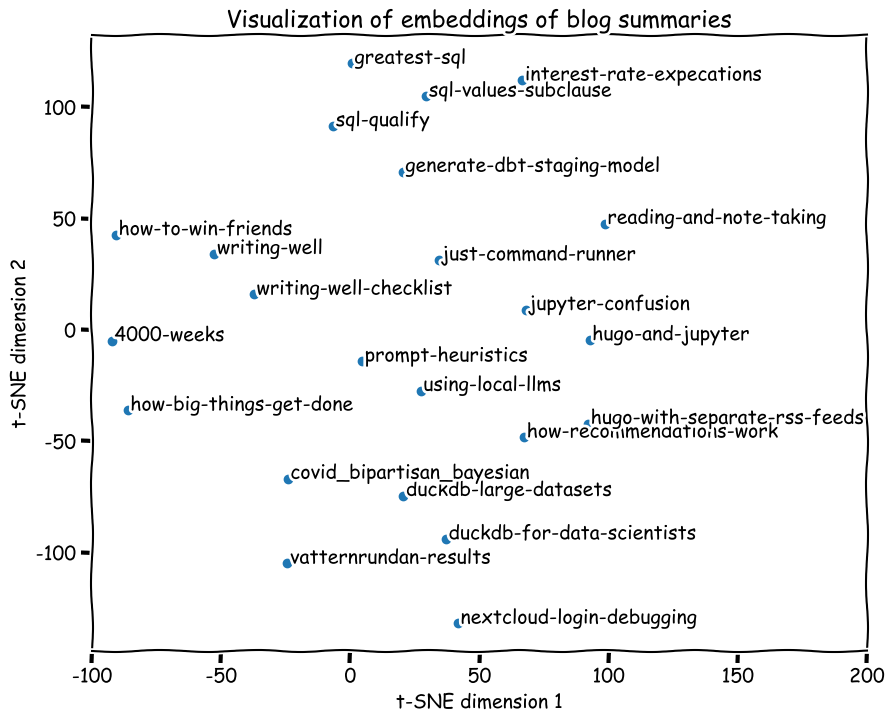
The plot looks somewhat reasonable. The code-heavy Jupyter notebook posts are at the bottom, clustered around duckdb-large-datasets. The book reviews (4000-weeks, how-big-things-get-done, how-to-win-friends) are fairly close together. SQL related posts are clustered at the top. On the other hand, I would have expected reading-and-note-taking to be closer to writing-well.
§Code
I am using this langchain script to compute the recommendations.
§Update
A previous version of the code and blog post used Llama 3.1 to summarise the text and ChromaDB’s default embedding model all-MiniLM-L6-v2.
If you have any thoughts, questions, or feedback about this post, I would love to hear it. Please reach out to me via email.
#data-engineering #llm #llama