TIL how to profile memory in python
⋅ 3 minute read
In my job I often work on pipelines that process a large amount of data in batches. Sometimes the batches are defined outside the task and sometimes the task itself processes its data in batches.
Problem
A common question is how to choose the batch size that is used to break up the data to be processed into smaller managable parts. In many cases increasing batch size means decreasing the time for the whole dataset to be processedThis is of course not always the case, but often holds true in practice.. At the same time it increases the memory usage of the task at any point in time.
When these tasks run in containers in kubernetes they tend to have a fixed amount of memory available. Increasing the batch size too much means that the container will run out of memory and the task will fail.
So the question that often comes up is “How to choose the largest batch to safely fit onto the container?”
Solution
Our data transformations are written in python. I can use the memory_profiler to sample memory consumption while the task runs and stash the data in a file.
- Install the package (in this case in a
poetryproject):$ poetry add --group dev memory-profiler - (Ideally:) Make your python code locally runnable.
- Prepend your python run with
mprof run:This will record memory usage over time and stash it as a .dat file in the current directory.$ poetry run mprof run dataprocessing_task.py - You can then plot the memory usage over time with
which plots the last found file with
$ poetry run mprof plotmatplotlib.
The .dat files are pretty simple:
CMDLINE /Users/dir/.venv/bin/python dataprocessing_task.py
MEM 0.187500 1776791347.5081
MEM 40.484375 1776791347.6133
MEM 59.218750 1776791347.7185
MEM 89.812500 1776791347.8203
MEM 114.078125 1776791347.9246
MEM 121.906250 1776791348.0287
MEM 133.640625 1776791348.1339
MEM 140.921875 1776791348.2365
MEM 151.546875 1776791348.3406
MEM 156.515625 1776791348.4457
MEM 167.468750 1776791348.5508
MEM 178.625000 1776791348.6560
MEM 194.421875 1776791348.7611
MEM 211.218750 1776791348.8663
MEM 225.031250 1776791348.9714
MEM 236.187500 1776791349.0765
MEM 252.156250 1776791349.1817
where the first column is the memory usage in MiB and the second column is a unix timestamp.
In my use case I wanted to compare memory consumption of two different batch sizes (30k and 300k). So I profiled the task twice and stored both .dat files.
I then use this claude-generated python script to visualize and compare memory consumption of the batch size options:
import glob
import sys
from datetime import datetime
from pathlib import Path
import matplotlib.pyplot as plt


def load_mprof(path: str) -> tuple[list[datetime], list[float]]:
    """Parse an mprof .dat file. Returns (timestamps, memory_in_MiB)."""
    times, mems = [], []
    with open(path) as f:
        for line in f:
            parts = line.split()
            if not parts or parts[0] != "MEM":
                continue
            mems.append(float(parts[1]))
            times.append(datetime.fromtimestamp(float(parts[2])))
    return times, mems


def main(paths: list[str]) -> None:
    if not paths:
        paths = sorted(glob.glob("mprofile_*.dat"))
    if not paths:
        raise SystemExit("No .dat files found.")

    fig, ax = plt.subplots(figsize=(10, 5))
    for path in paths:
        times, mems = load_mprof(path)
        if not times:
            print(f"skip {path}: no MEM samples")
            continue
        # plot seconds since start of this run, so runs align on x-axis
        t0 = times[0]
        xs = [(t - t0).total_seconds() for t in times]
        ax.plot(xs, mems, label=Path(path).stem)

    ax.set_xlabel("Time since run start (s)")
    ax.set_ylabel("Memory (MiB)")
    ax.set_title("Memory usage over time")
    ax.legend()
    ax.grid(True, alpha=0.3)
    plt.tight_layout()
    plt.show()


if __name__ == "__main__":
    main(sys.argv[1:])
Here is the plot:
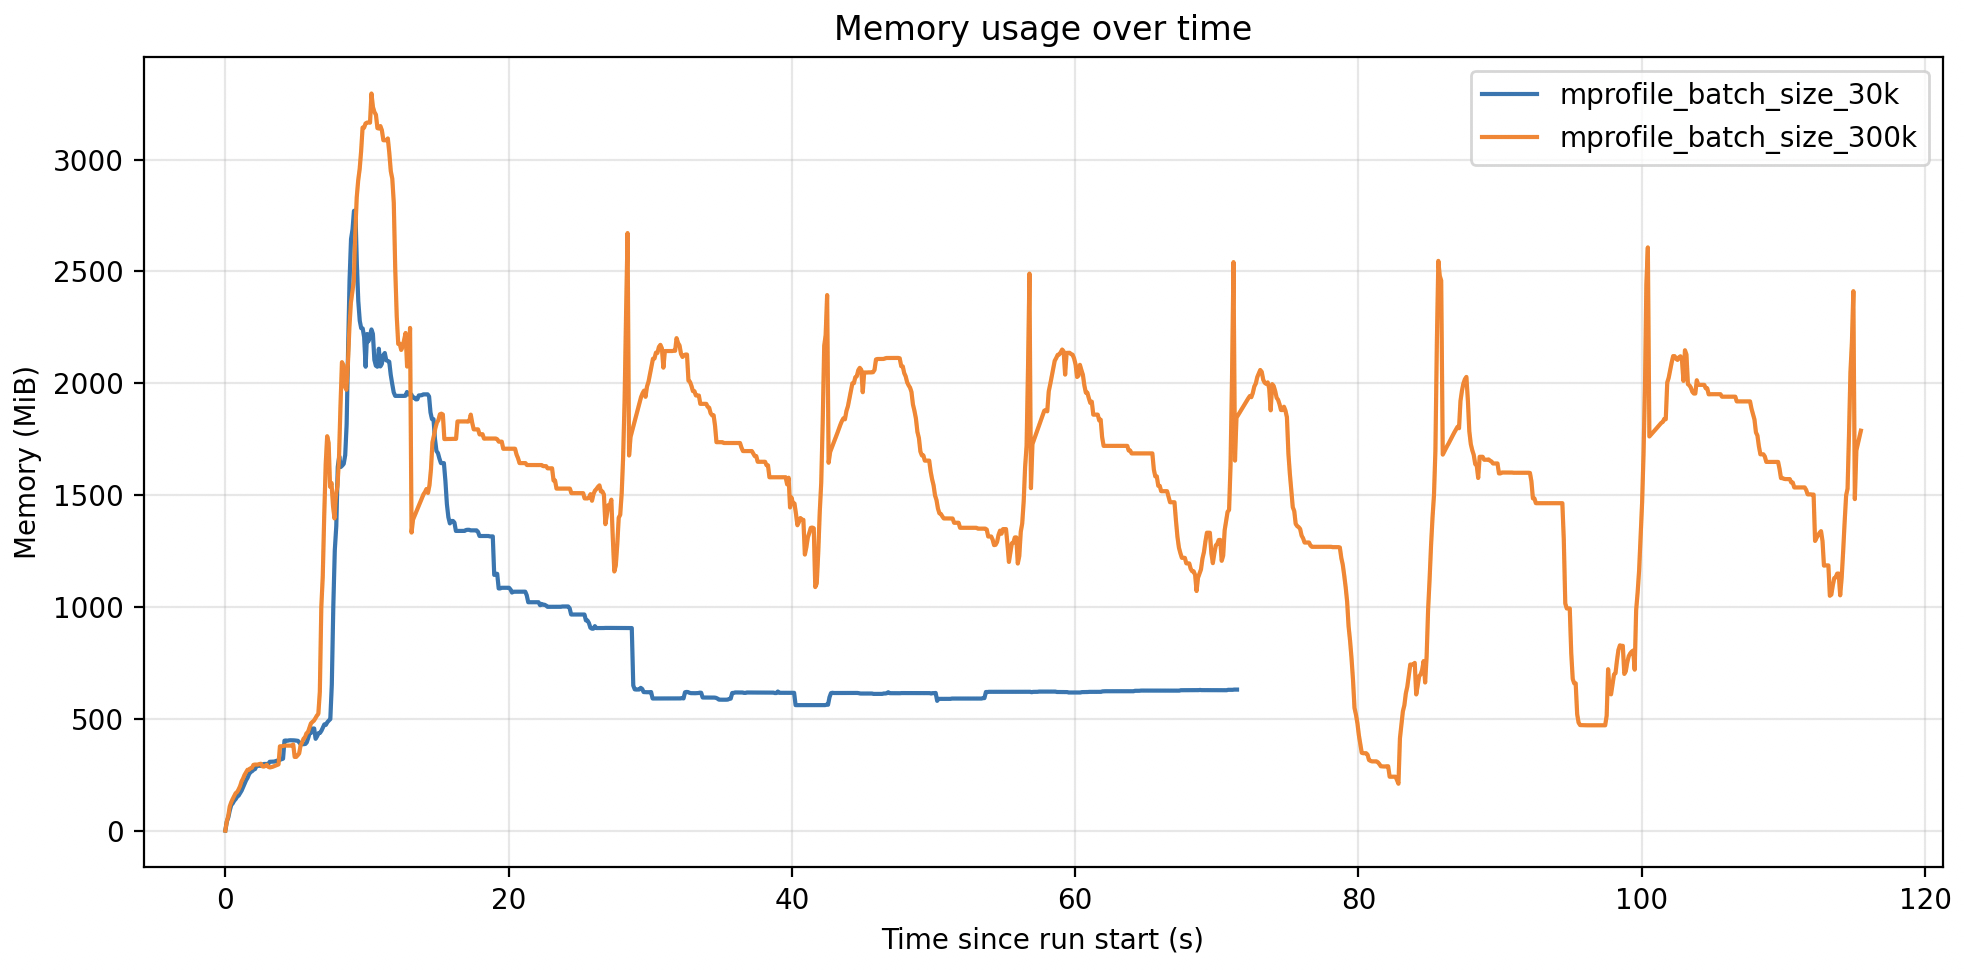
In this case my container had 6GB of memory available for the python task, so I could safely increase the batch size to 300k and reduce the runtime of the task by 5x.
If you have any thoughts, questions, or feedback about this post, I would love to hear it. Please reach out to me via email.
Tags:#python